Skip to content
All AI Kits
Design system Paid source11 components

Observable-inspired Signal Notebook

An original, unofficial Observable-inspired system for reactive notebooks, executable explanations, and data visualization surfaces. It retains only 11 focused elements supported by Observable's live notebook and chart workflows.

Includes DESIGN.md, tokens.json, full CSS, Tailwind v4 token mapping and matching UI specimens. Preview for free; protected guidance and style downloads require Starter or Super. Framework installation and theme support are verified only where listed.

Theme support:
Unverified
Installation:
No verified installation path listed
Delivered component specimen

Run notebook ↗ Share ▶
0
149
Design foundations

Inspect the kit's typography, palette, icons, spacing and motion.

Style identity

Signal Notebook

A dark, editorial system for reactive notebooks where executable code, data output, and concise explanation share one visual lane.

Reference style: Technical minimalism, dark data wall, chart-paper whites, and mint reactive sign
Visit website

Typography

Font families

Inter

Body copy, navigation, labels, and actions observed in the live site.

Inter, ui-sans-serif, system-ui, -apple-system, Segoe UI, sans-serif
Weights
400,500,600,700
Sizes
14px,16px
Line height
20px,24px
Tracking
0,-0.01em

Fallback: ui-sans-serif, system-ui, -apple-system, Segoe UI, sans-serif

Spline Sans Mono

Display and section headings observed in Observable's current homepage.

Spline Sans Mono, SFMono-Regular, Menlo, Consolas, Monaco, monospace
Weights
400,500,600
Sizes
32px,40px,56px
Line height
1.2,1.14
Tracking
0,-0.02em

Fallback: SFMono-Regular, Menlo, Consolas, Monaco, monospace

Notebook code mono

Executable cell code, command hints, and data values.

ui-monospace, SFMono-Regular, Menlo, Consolas, Monaco, Liberation Mono, monospace
Weights
400,500
Sizes
12px,13px
Line height
18px,20px
Tracking
0,0.02em

Fallback: monospace

Palette

Core colors

Notebook canvas / light

#f0f7f5

Bright documentation and review canvas.

Notebook canvas / dark

#0c1112

Primary deep notebook wall.

Output surface / light

#ffffff

Chart, table, and code-paper surface.

Output surface / dark

#141b1c

Raised cell and panel surface.

Ink / light

#13221f

Primary readable text on bright surfaces.

Ink / dark

#effbf7

Primary text on the dark data wall.

Reactive mint / light

#1f9f8d

Primary action, focus, and active cell.

Reactive mint / dark

#52d8c0

High-contrast action and signal on dark.

Data amber

#f5b86a

Secondary chart series and notable data point.

Hairline border

#30433e

Low-contrast cell and table division.

Type scale

Responsive hierarchy

RoleSizeWeightLine heightTracking
Display desktop56px50064px—
Display mobile40px50048px—
Section40px50048px—
Body16px40024px—
UI14px60020px—
Code12px40018px—

Spacing & shape

Layout rhythm

Density
Base unit
Max width
Section gap
Card padding
Element gap

Iconography

Small geometric inline SVG marks with occasional filled brand shapes.

1.5px to 2px where outlined; use currentColor. stroke · 16px / 20px / 24px

Use currentColor, pair symbols with labels for important actions, and preserve optical alignment.

System metrics

Radius

Sm 6pxValue 6pxMd 10pxValue 10pxLg 16px

Spacing

1 4pxValue 4px2 8pxValue 8px3 12px

Motion

Fast 180msValue 180msStandard 250msValue 250msEasing ease-out

Guidelines

Do

  • Keep code and output adjacent so the relationship is immediately legible.
  • Use one mint action and one amber data signal at a time.
  • Keep chart labels and exact values readable without hover.
  • Preserve a visible keyboard focus ring and an accessible status announcement.

Don't

  • ×Do not turn a notebook specimen into a dashboard.
  • ×Do not use a generic gradient where a meaningful data or code relationship belongs.
  • ×Do not rely on color alone to distinguish a series or reactive state.
  • ×Do not copy Observable copy, logo geometry, screenshots, or proprietary assets.

Imagery

Prefer original data visualizations, SVG plots, and CSS geometry. Never use Observable screenshots, logo artwork, notebook captures, or proprietary chart assets.

Layout

Use an asymmetric code/output mosaic on desktop, with the headline and next action anchoring the first scan. Collapse to one deliberate reading order at 390px.

Assigned collection

Signal Notebook Interface Elements

11 published components in collection order

Components

Built from the same system

These working component previews are supplied with the kit. Open a component to inspect its code; the reference screenshots show the original website.

Open collection
Run notebook ↗ Share ▶
0
149
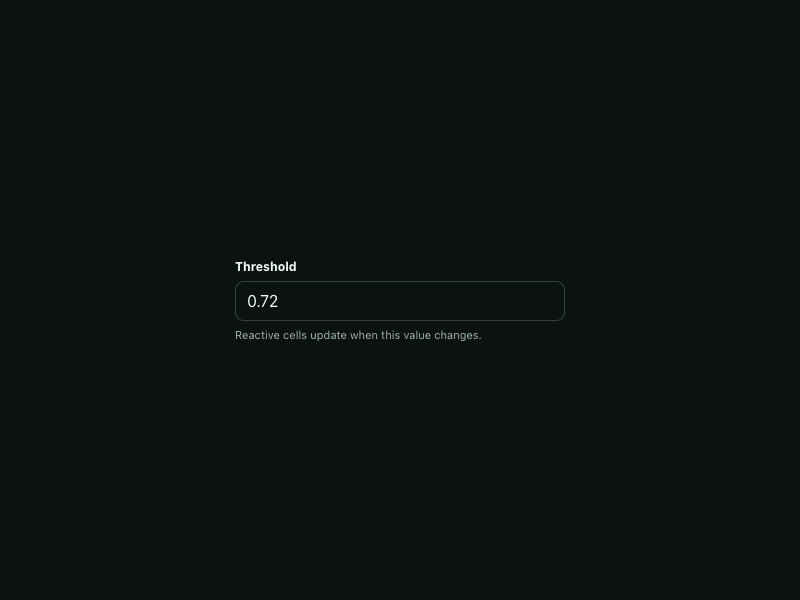
Threshold Reactive cells update when this value changes.
0
186
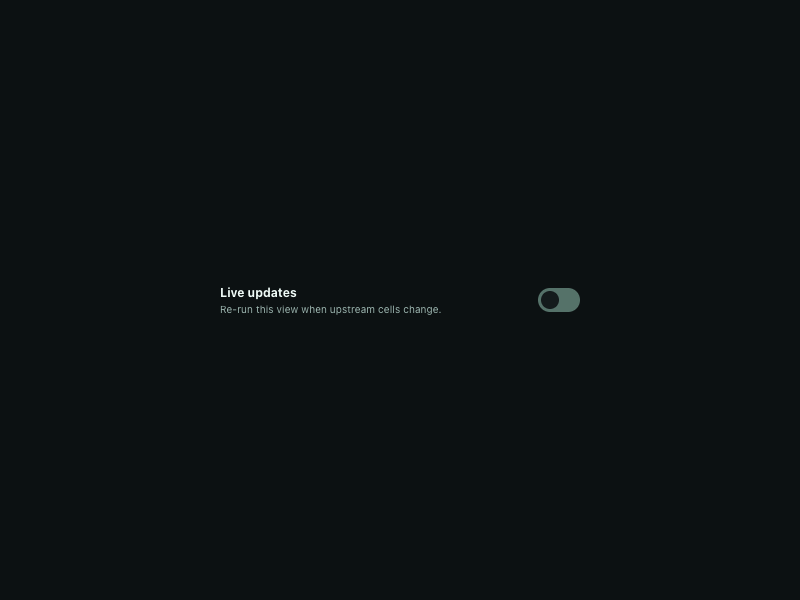
Live updates Re-run this view when upstream cells change.
0
139
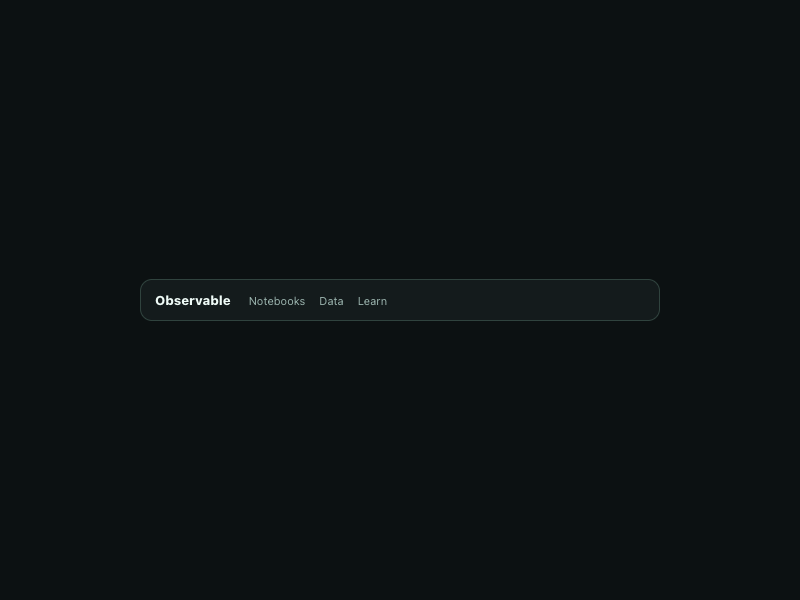
Observable Notebooks Data Learn
0
150
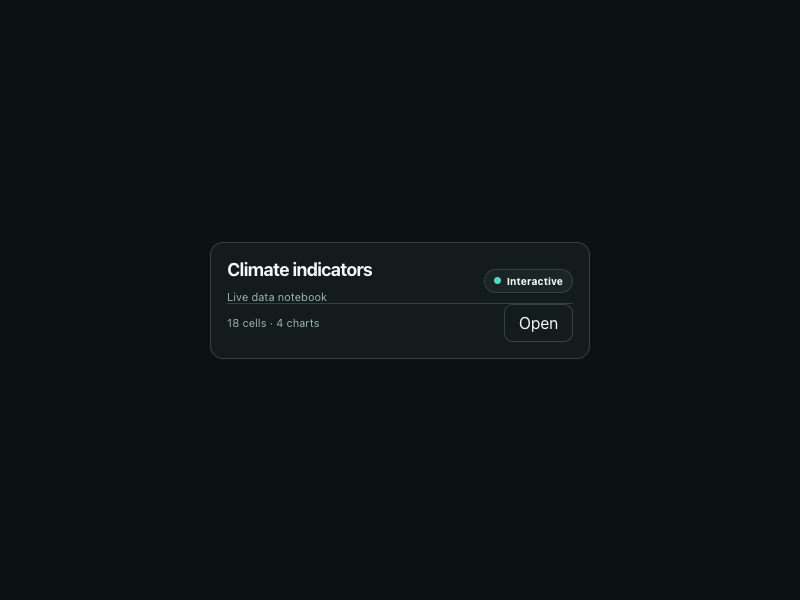
Climate indicators Live data notebook Interactive 18 cells · 4 charts Open
0
126
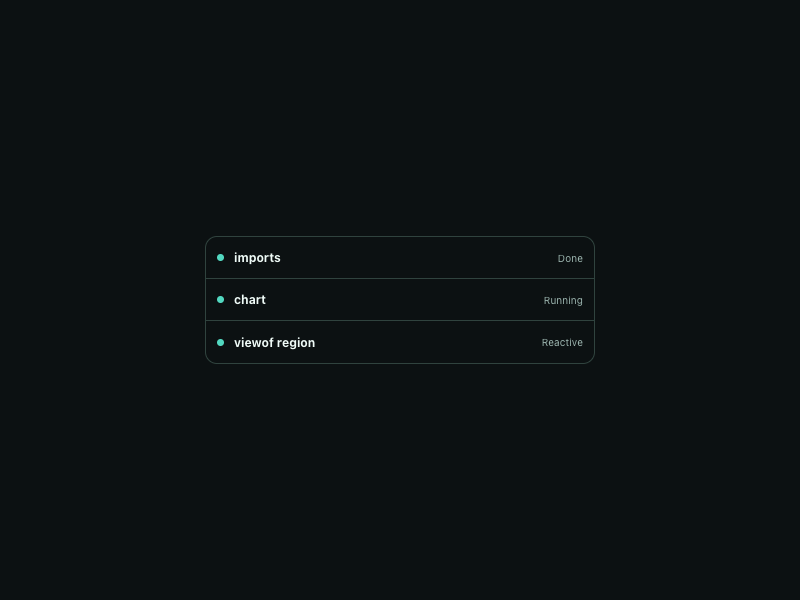
imports Done chart Running viewof region Reactive
0
144
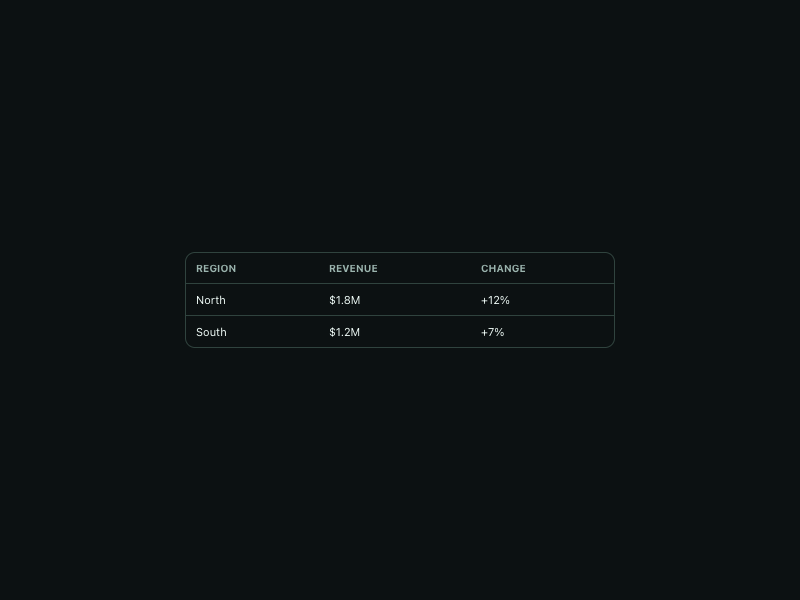
Region Revenue Change North $1.8M +12% South $1.2M +7%
0
130
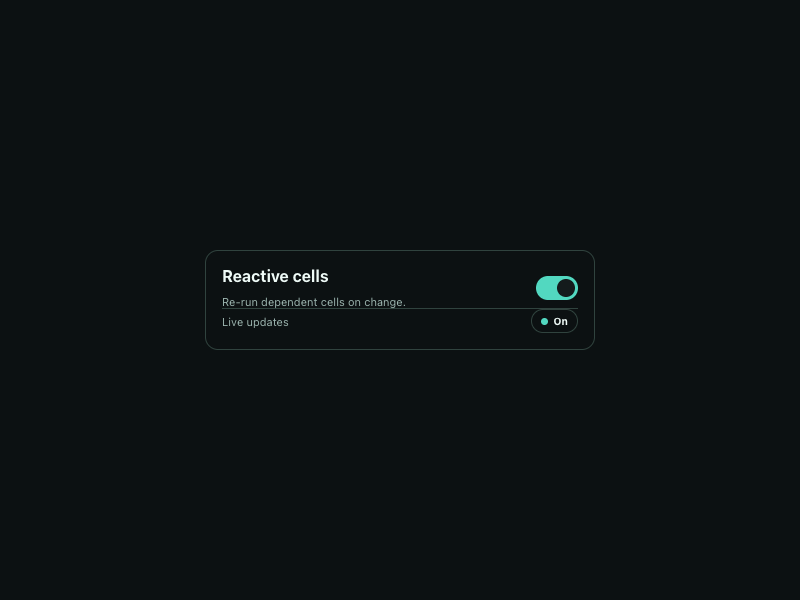
Reactive cells Re-run dependent cells on change. Live updates On
0
132
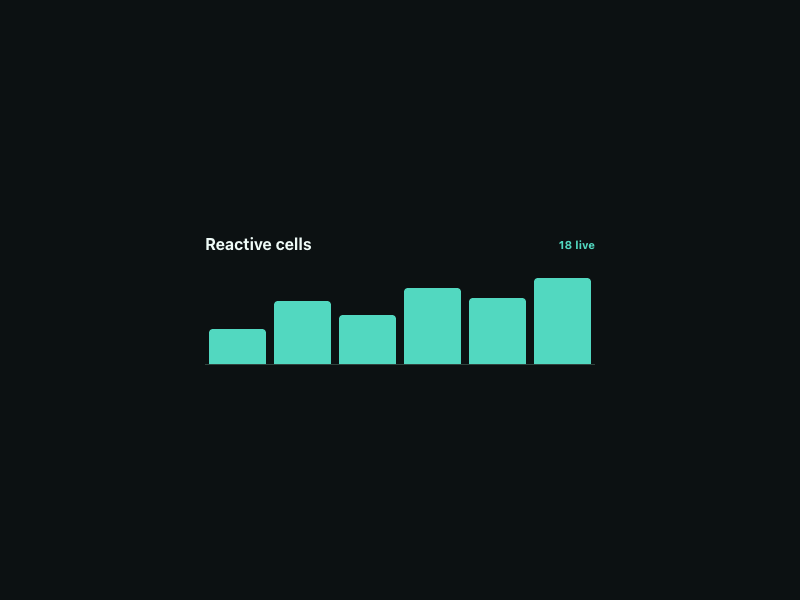
Reactive cells 18 live
0
123
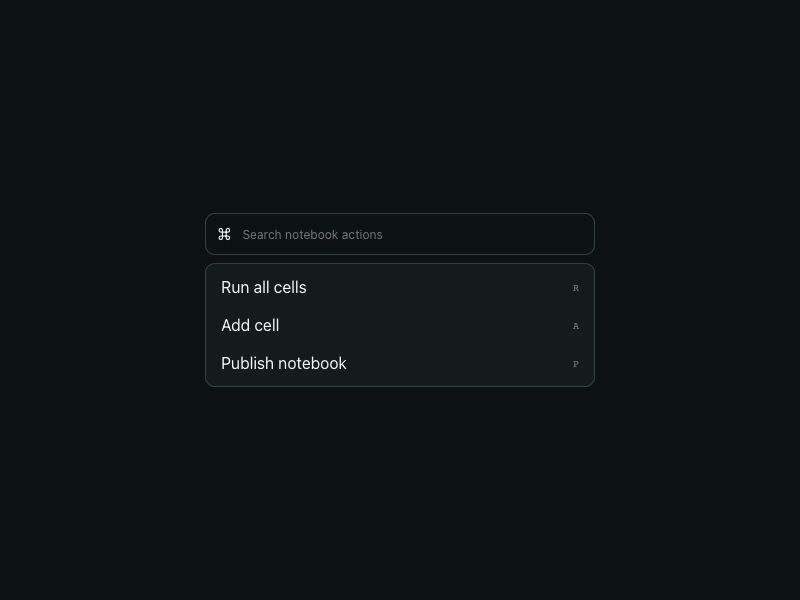
⌘ Run all cells R Add cell A Publish notebook P
0
136
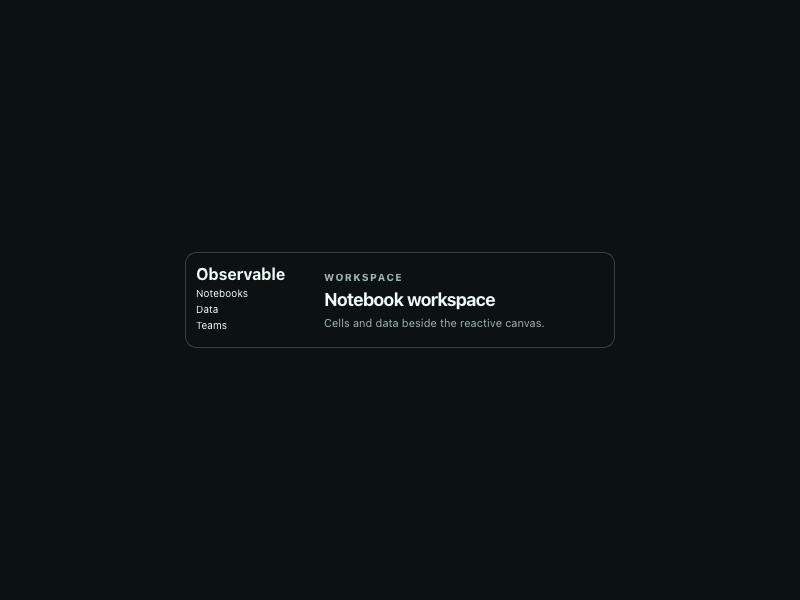
Observable Notebooks Data Teams Workspace Notebook workspace Cells and data beside the reactive canvas.
0
136

More AI Kits

Published AI Kit Protected source files for Starter and Super members